Q3 2023: The Erlik affaire
Oh! A storm is threatening
my very life today
If I don´t get some shelter
I´m gonna fade away
Welcome to the Thessalian scrolls. Enter freely. Go safely, and leave something of the happiness you bring.
If you have reached this place by chance, please find out what this is all about here. If you came willingly, take a sit and allow me to share some information that can be useful or, at least, entertaining.
It´s been quite a while. As I said in my last entry, I would report for Q3 in this one. But I did not expect that it would take so long, and I am truly sorry for that. Being a small part of the Big Machine, there have been lots of issues that have delayed my work. For my own good, I hope I can use more time to keep working on these scrolls, and in the near future be able to share some more information, and some pointless digression about the never-ending war of the Kindred.
So, this is the third stage on my 2023 accumulated reports. Here you will find a build-up of the data from January to September, shown either by aggregation, or by a view on their evolution (and sometimes both).
As you can see in the title, this time I will be highlighting the Harbingers of Skulls, as the most successful clan in the third quarter. The biggest event where they performed was in the town of Novy Rychnov, in the Czech Republic, and I could not resist the temptation to feature the old and beautiful capital city of that country.

SCOPE.
So, let´s see the nature of the data I will be showing. I am gathering information of Tournament Winning Decks from tournaments reported in the VEKN, and building a series of charts featuring different aspects of the game. There are a number of events and decks that happened in the period, that are not being counted. as I can only include in my records those events for which I do have access to that deck. Let´s see the first chart:


As you can see, after a very good second quarter (in terms of TWD publication and information sharing), Q3 has gone down a little. A lot of people are working to share these data with the community: The VEKN managers, Princes all around, other event organizers and also some players that add more details. I feel quite thankful for their efforts, and encourage them to keep on performing these deeds that, in my opinion, make the community (and the game), expand and be richer.


ZONES.
Each time I work with these data, I love to see the diversity and colour of the different communities. Imagining how the WoD features adapted to different locations of the planet (mainly centered around the different cities), was one of my favorite staples for enjoying this lore. I think this is quite well represented in the VTES competitive scene, as the details of the different remarkable events usually is linked to the particular city where they take place. For the sake of simplicity, I have grouped the events in regional communities, and you can see them, ordered according to the accumulated number of participants in the first three quarters of 2023:

WINNERS.
These are the tournament winners this year. Jaddou is still at the top, and we will see if some other of the great players in the scene can win over more participants. The amount of players that should be listed here is huge, and the resolution of the site does not allow me to share it complete. So, I will show you the first 30:

Explanation:

Here you can see the total victories achieved by each clan (V), the percentage over the total (%V), and also the number of players on those events (P), along with the % over the total players of the given period (%P). You can see the rating accumulated in each quarter Finally, in green, you find the accumulated total Rating of each clan.
Let me highlight some data calling my attention this season:
Gangrel retakes the lead in the accumulated, after a Q3 that was not easy for their main competitor, Tremere. Harbingers of Skulls have been the clan of the season, and they grow in the accumulated rate from 5th to 3th. Will they keep on their ascendancy? Which one will be the clan of the year?
We can see that the five clans are the top are the same as in Q2: Gangrel, Tremere, Harbingers of skulls, Ministry and Banu Haqim. Three of them enjoyed the publication of a 5th edition decks. And the fourth in that bundle was Brujah, which is placed 6th in the 2023 ranking of TWDs. This gives us an idea of the reception of that particular bundle (and the reinforcement received later).
Let´s see their evolution from another perspective:

Banu Haqim, and Ministry show a more or less consolidated presence. Among the other three, we can see an evolution in Q3 that has deeply hurt Tremere, allowing the growth of Harbinger and Gangrel. I am eager to consolidate the data of the final quarter of the year, and proclaim a winner.
But again, balance seems to be a staple in the metagame. 32 clans are represented (out of 39), and we can see a bunch of clans having higher success than others, but by no means any abuse, nor even a clear supremacy. These are wonderful times for a wonderful game.


Explanation:


The trend that we could see in the second quarter is continued in the Q3, and it is reducing. The average of the monthly rating so far this year went down to 19% (it was 21% after Q2). As usual, I am rating the decks according to the number of players in the events they won.
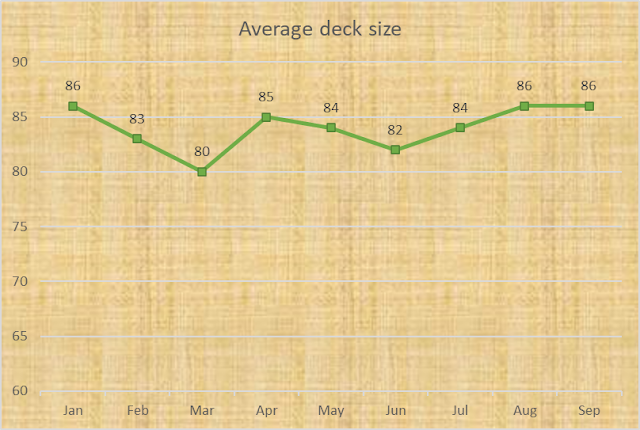
You can see it more accurately in the next chart, where I show the compared evolution of three kind of decks: 90-card decks, those that pack 80-89 cards, and those with less than 80 cards. The data are applied considering the number of players defeated, as usual. 90 card decks are still the most frequent, and the global average is 58%. TWDs with 80 to 89 cards are 20%, and the other 22% of the decks packed less than 80 cards.


The Rating is again calculated attending to player counts in the tournaments won by these decks.


Unlock Your Brand's Potential with Expert logo design dubai! Our skilled designers in Dubai craft unique logos tailored to your brand's identity, ensuring you make a memorable impression in the competitive market.
ResponderEliminarLooking for reliable tire services in Ajman? Visit our top-notch Tyre Shop Ajman for expert assistance with all your tire needs.
ResponderEliminarDiscover a curated realm of artistic finesse and culinary innovation with a platform dedicated to redefining Restaurant design dubai. Immerse yourself in the captivating world of Armando Interior, where every click unveils a symphony of creativity and sophistication.
ResponderEliminar" Choose The Right Indian Battery Supplier In Baghdad, Iraq" is a comprehensive online platform catering to the battery needs in Baghdad, Iraq, offering a diverse range of Indian battery solutions. With a focus on quality and reliability, this website serves as a go-to destination for individuals and businesses seeking top-notch battery products for various applications.
ResponderEliminarDiscover a premier hub for Diesel Supplier In Ajman at Al Faraji Oil. Our platform caters to the diverse needs of businesses and industries, offering top-quality diesel products to fuel operations efficiently.
ResponderEliminarArmando Interior, an online destination dedicated to Stylish Room Transformations, offers a wealth of inspiration and expertise for those seeking to elevate their living spaces.
ResponderEliminarAl Faraji Oil and Diesel Trading, a prominent Diesel Trading Company in Sharjah, specializes in providing high-quality diesel and oil products to various industries across the region. Known for their reliable service and competitive pricing, Al Faraji caters to the fuel needs of businesses, ensuring timely delivery and excellent customer support.
ResponderEliminarJDiyan International is a prominent supplier of Batteries in Yemen, offering a wide range of battery solutions tailored to various needs. The company provides high-quality batteries suitable for automotive, industrial, and renewable energy applications.
ResponderEliminarArmando Interior's website is a showcase of exquisite Restaurant design dubai tailored for the vibrant landscape of Dubai. With a keen eye for aesthetics and functionality, they craft spaces that elevate dining experiences to new heights.
ResponderEliminarArmando Interior invites you into a realm where luxury meets innovation in the heart of Dubai's design scene. Renowned as one of the Top interior designers dubai, Armando Interior epitomizes sophistication, offering an unparalleled fusion of elegance and functionality.
ResponderEliminarExplore a wide selection of high-quality tires available for purchase Online tires uae. Enjoy the convenience of great deals and reliable options right at your fingertips, ensuring exceptional value and performance.
ResponderEliminarDiscover the best deals on Lenovo Laptop price in Karahi, offering the latest models at competitive prices. Find your perfect Lenovo laptop with unbeatable offers today!
ResponderEliminarUnlock your business's potential with the expertise of a top website development company. Specializing in custom web design, mobile optimization, and effective SEO strategies, we create impactful online experiences. Partner with us to transform your vision into a powerful digital presence.
ResponderEliminarAchieve greater efficiency and cost savings with the Logistics Software in Dubai, tailored to meet the unique challenges of the region's logistics industry.
ResponderEliminarLooking to hire dedicated progressive app developers ? Our team is ready to deliver innovative solutions that blend seamless performance with cutting-edge technology. Let's elevate your app experience together!
ResponderEliminarA fit out company in Dubai
ResponderEliminarexcels at converting empty spaces into stylish and functional environments. These companies offer comprehensive services, from design to implementation, ensuring each project meets the unique needs of clients. Their expertise helps create interiors that blend luxury with functionality in Dubai’s dynamic landscape.
Tyre Change In Dubai Dervice provide quick and professional replacement options for all types of vehicles. With convenient locations and mobile services, you can ensure your vehicle's tyres are safely and efficiently changed, keeping you on the road with minimal downtime.
ResponderEliminarMens varsity jackets are a classic addition to any wardrobe, offering a perfect mix of style and comfort. With their iconic design featuring contrasting sleeves and durable fabric, these jackets are ideal for casual outings, college events, or weekend hangouts. Available in various colors and materials like wool, leather, or satin, mens varsity jackets pair effortlessly with jeans, sneakers, or hoodies. They are lightweight yet warm, making them suitable for all seasons. Whether you want to show school spirit, support your favorite team, or simply upgrade your style, mens varsity jackets provide a timeless, versatile, and trendy look.
ResponderEliminar